
Software: Unreal Engine 4.19.2
Plug-in: RenderDoc (free)
Hardware specs: CPU Intel i7-6900K (8+8 core) | GPU GTX 1060 6GB
The Unreal Engine world differs a lot from what we’re used to in 3D Studio Max.
First of all, Unreal is a Game Engine so it can’t be used like a common rendering software. The main problem when using a software with real time rendering is that we have to pay lot of attention to the performance, that is not to exceed the maximum limit of time used to render the single frame. According to the hardware on which “the game” will be played, we’ll have a different Frame Per Seconds (FPS) target, also expressed in milliseconds (ms). For example, for a VR headset the target is 90 FPS, which means that each frame has to be rendered in 11.1 ms during the entire game.
The analysis of the performance and the following optimization of the scene are two essential steps in the project creation. However to optimize a scene, it is first necessary to analyze where the problems lie. In this way we don’t have to optimize the entire scene but we can only concentrate on the areas where optimization is most needed.
In this tutorial we’ll see a small part of the performance analysis process to understand what slow down rendering in a scene.
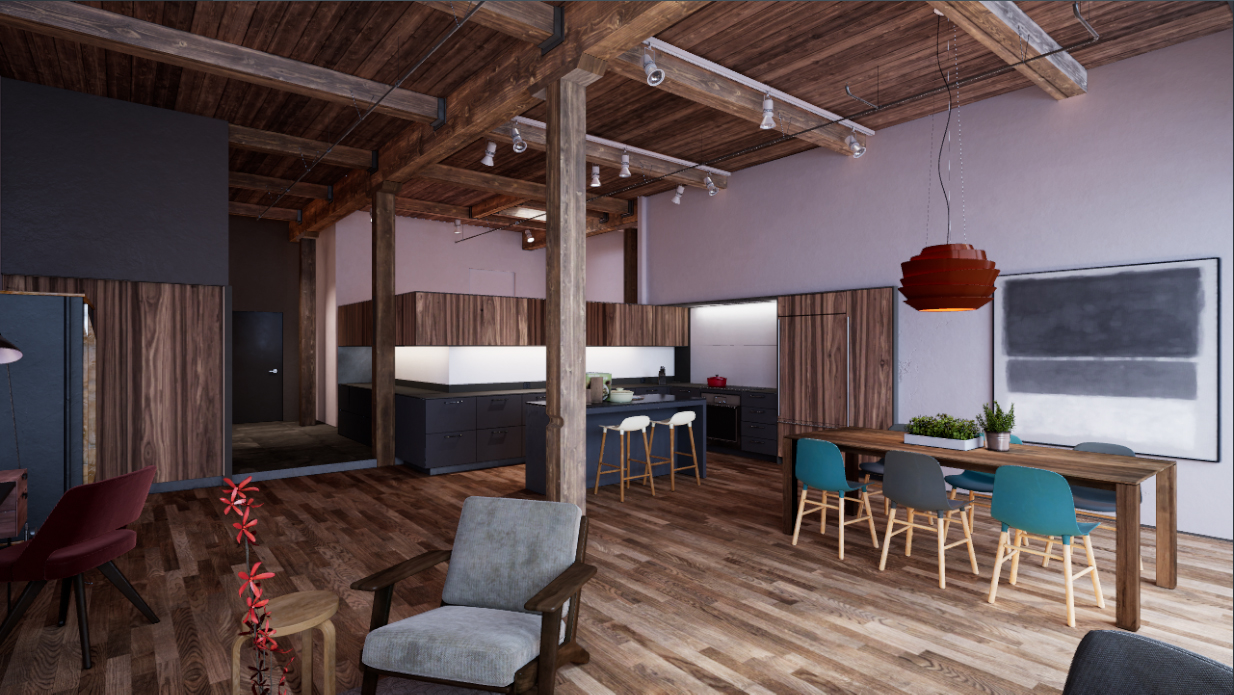
We’ll use a scene from the San Francisco Loft as an example.
Some observations before starting:
- the scene was created with static lights; in this way we know that lights and shadows won’t be a problem for performances.
- in the scene there isn’t any kind of optimization.
To analyze the scene, or better a frame, we’ll use a software external to Unreal Engine: RenderDoc (in the plugin section of UE, there’s a plugin already preinstalled to work with RenderDoc. Now you only need to download the software).
Inside the scene we decided to analyze the following frame because it is one of the heaviest to render as its rendering time takes 15.18 ms, which is far beyond the limit of 11.1 ms:
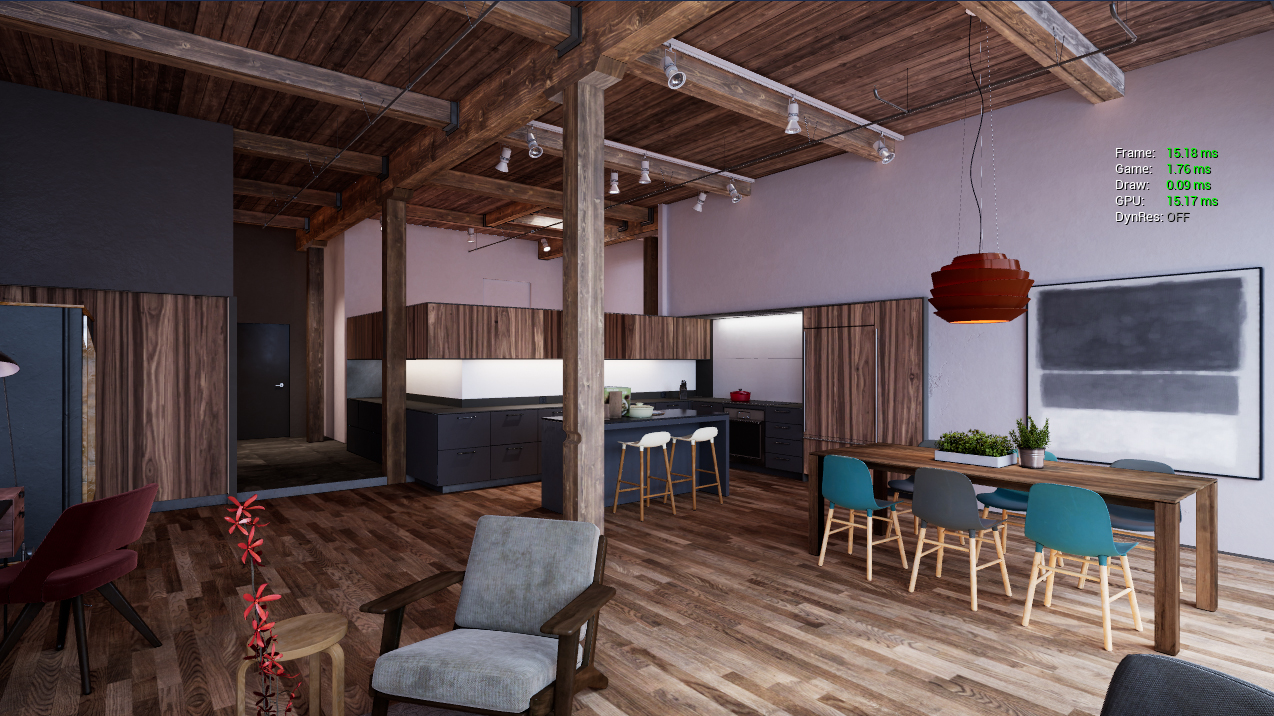
Let’s try to determine what problems there could be:
- Draw value (CPU) is 0.09 ms
- GPU value is 15.17 ms
The rendering slowdown is certainly due to the GPU.
Now, let’s open the frame in RenderDoc which will help us to determine where we lose most of the time within 15.17 ms.
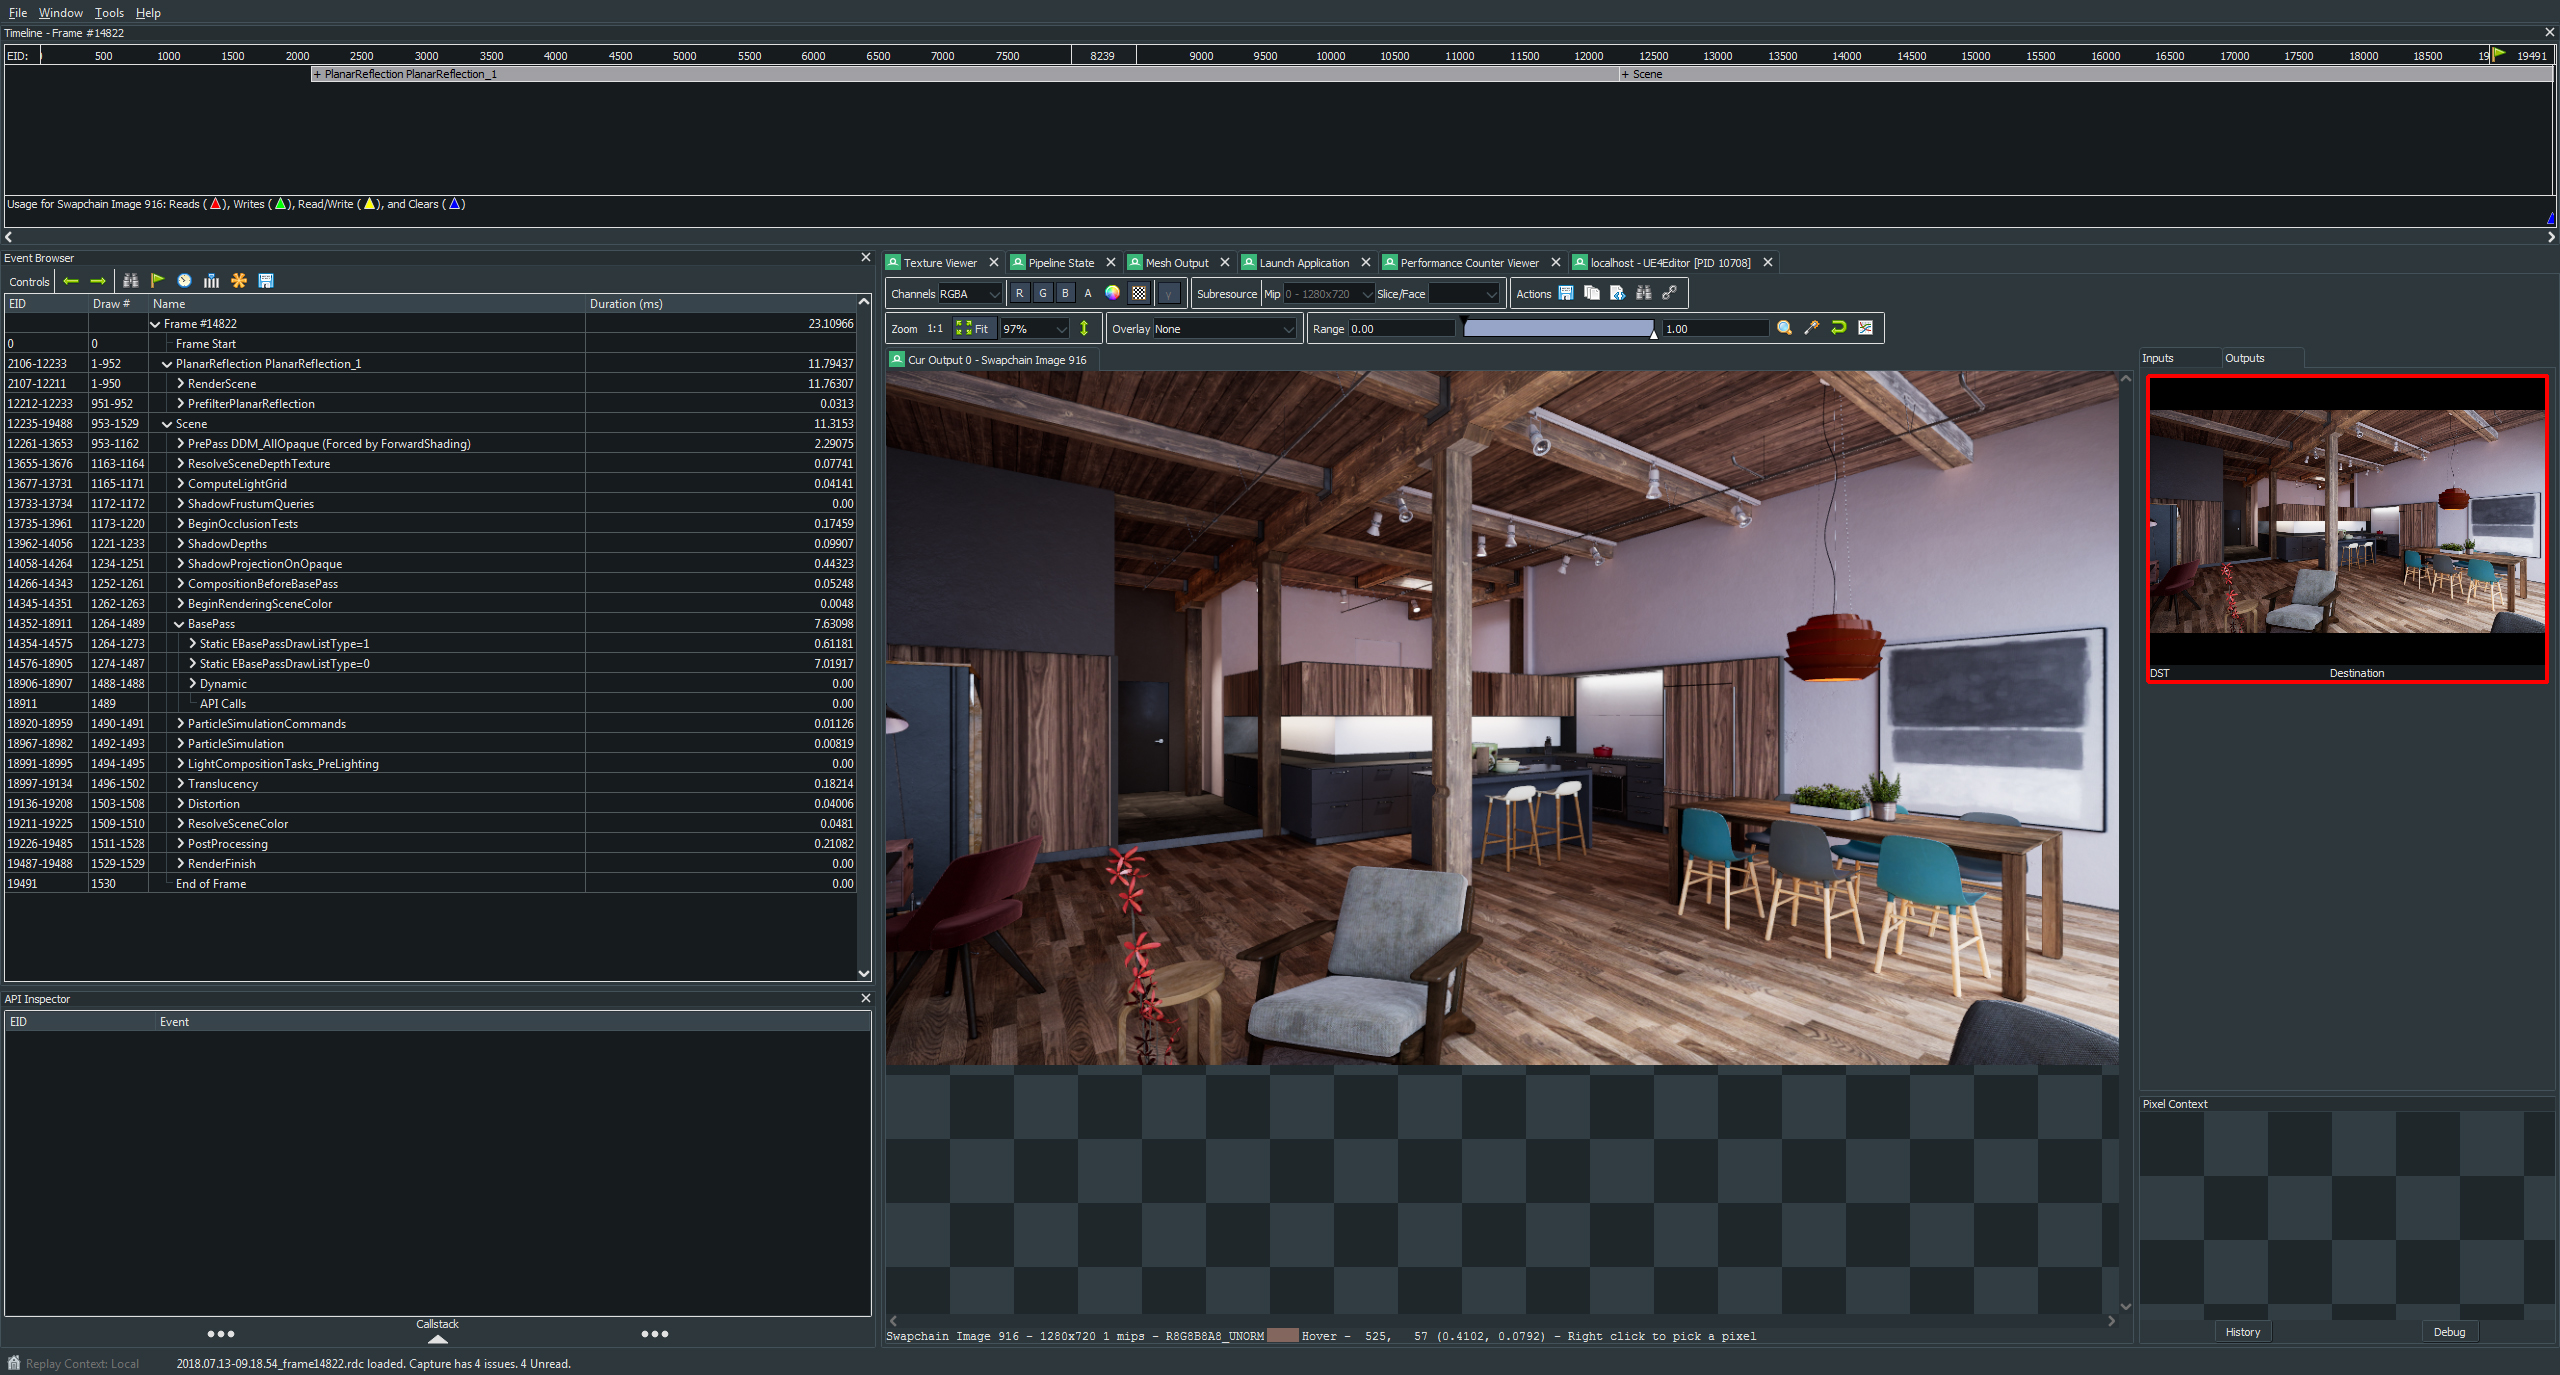
The RenderDoc’s viewport is full of information but luckily we only need few of them.
On the left we have the Event Browser where we can see how long every single draw call takes to be rendered by the GPU:
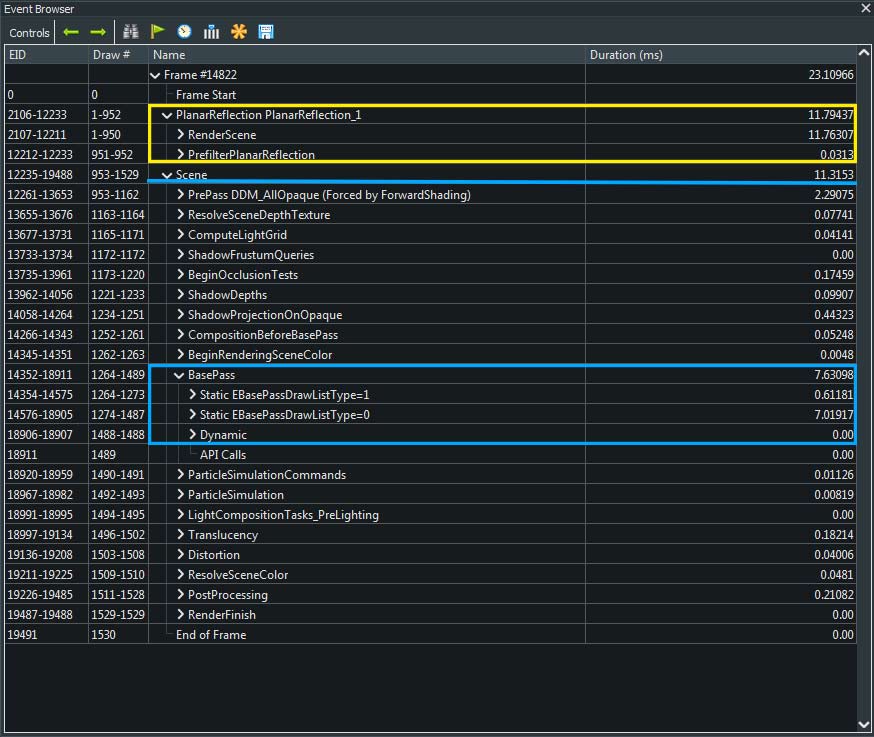
In the image we highlighted two areas inside the Event Browser:
- in blue: the group related to the scene “construction”, which means the rendering of each single object in the scene (called BasePass).
- in yellow: the calculation process needed to create the reflections then used by the PlanarReflection (one of the type of reflections in Unreal).
By confronting the time used to calculate the PlanarReflections and the time used to render the scene, we notice that they are quite similar:
- Scene PlanarReflection 11.79ms
- Scene “BasePass” 11.32ms (blue line)
Unless you have already guessed why it happens, the explanation is that Unreal renders twice when creating the reflections used by the PlanarReflections: it first creates the mirrored scene and then the full scene and this may cause a strong slowing down.
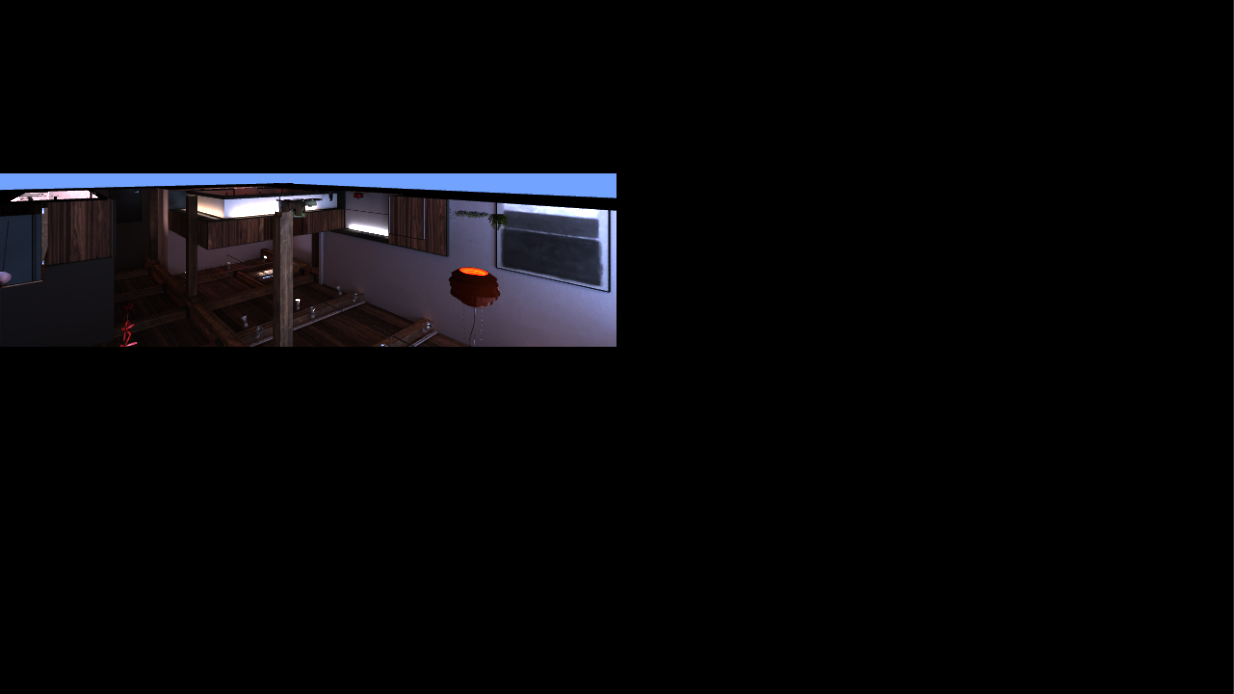
On the left you can see the PlanarReflections’ rendering, on the right the full frame. Note that it takes more time to render a frame where ¾ of the image is black than the frame of the final scene.
Reflections are only one of the problems related to this scene. In our next tutorial, we’ll use again the tools in RenderDoc and go into deep to find out which elements slow down the rendering.
Part 2 coming soon,
Enrico